StackViz User Interface
Note
The information in this section refers to both StackViz as a standalone application and as the widget inside SimPart, but for simplicity the section will detail the functionalities of StackViz considered as an application. The functionalities are the same in case of the widget.
StackViz Application Toolbar
The application bar presents several icons to perform actions such as opening datasets, centering the playback focus and changing the data visualization options.

Fig. 18 StackViz application tool bar.
For more information click on application menu “File”, “Playback” and “Options” to relate icons to specific commands.
File Menu
Open BlueConfig: Load the circuit from the given BlueConfig file with the specified target.
Open CSV: Loads a dataset stored in a CSV file.
Open HDF5 network and activity: Loads a dataset in HDF5 format. The application will ask for the network file first and then for the activity file.
Connect to REST server…: Opens the REST connection dialog to connect and get data from a NEST source via Insite protocol (Fig. 19).
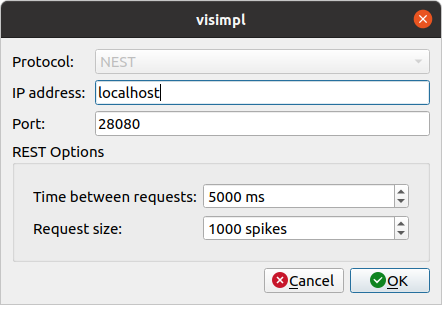
Fig. 19 REST connection dialog.
Open Subset/Events file: Loads a subset or events file of the dataset currently in memory.
Open Groups file: Loads a groups file generated and saved with SimPart.
Close Dataset: This option closes the current dataset in memory, resetting the application interface. If the current dataset is a REST connection then a close dataset dialog will be shown, letting the user choose between resetting the spikes data (and reloading again from the same connection) or fully closing the dataset (Fig. 20).
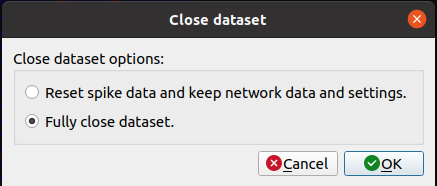
Fig. 20 Close dataset dialog when closing a REST dataset.
Options Menu
Toggle Playback Dock: This will show or hide the playback dock.
Auto naming selections: If this option is enabled a default name will be assigned to each selection.
Fill plots: If this option is enabled the plots will be filled with the color assigned to it. If not only the points of the graph will be shown with the color assigned.
Show Configuration Panels: Shows/Hides the configuration panels. Hiding the panels will make the focus widget wider.
Add ZeroEQ selections as histograms: Enable this option to visualize ZeroEQ received ids as histograms.
Configure REST connection…: Shows the REST configuration dialog where the frequency of the requests and the spikes size (Fig. 21).
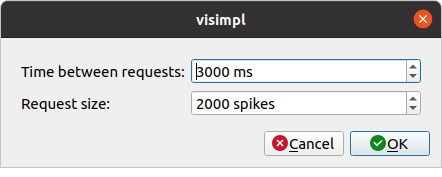
Fig. 21 REST connection configuration dialog.
Configuration panels
Several panels located in the bottom-right area of StackViz allows the user to configure several visualization options:
Normalization: Options to configure the histograms data normalization.
Scale adjustment: Options to configure the vertical and horizontal scale of the histograms.
Bins configuration: Options to set the number of groups of the values and its zoom factor.
Data inspector: Shows the value of the data currently being visualized and the local and global maximum values.
Rule configuration: Lets the user define the number of horizontal divisions of the histograms.
Histogram focus widget
The histogram focus provides an insight into the data selected or currently being played.
Fig. 22 Histogram focus.
Data manager widget
The data manager widget shows the subsets and events. The upper widget shows the events and allows the user to toggle the visibility or delete them. The lower widget shows the subsets and the number of elements in each of one, allowing the user to toggle the visualization or delete them.
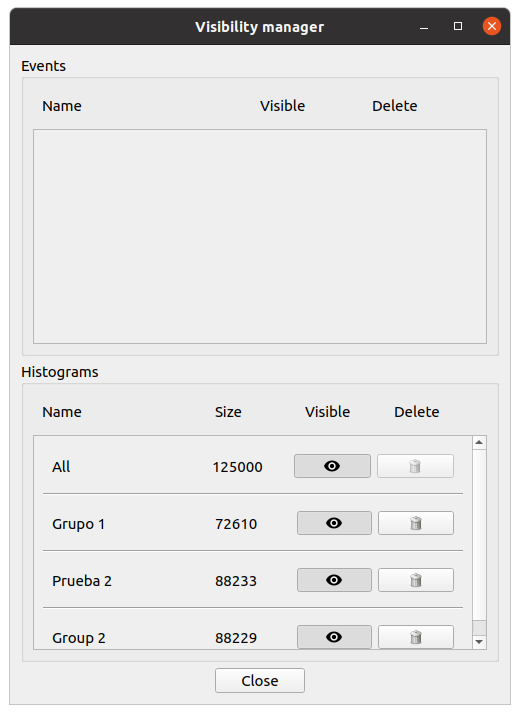
Fig. 23 Data manager widget.
StackViz Keys and shortcuts
The following actions can be performed by clicking the button, selecting the option at menu bar and pressing the corresponding key combination:
Ctrl + Shift + B: Open BlueConfig file.
Ctrl + P: Show/Hide “Playback control” menu.
Ctrl + A: Toggle enable/disable auto-naming sections.
Ctrl + G: Load Groups file generated with SimPart.
Ctrl + Q: Close application.
Ctrl + R: Shows the recorder configuration dialog or stops the recorder if already running.